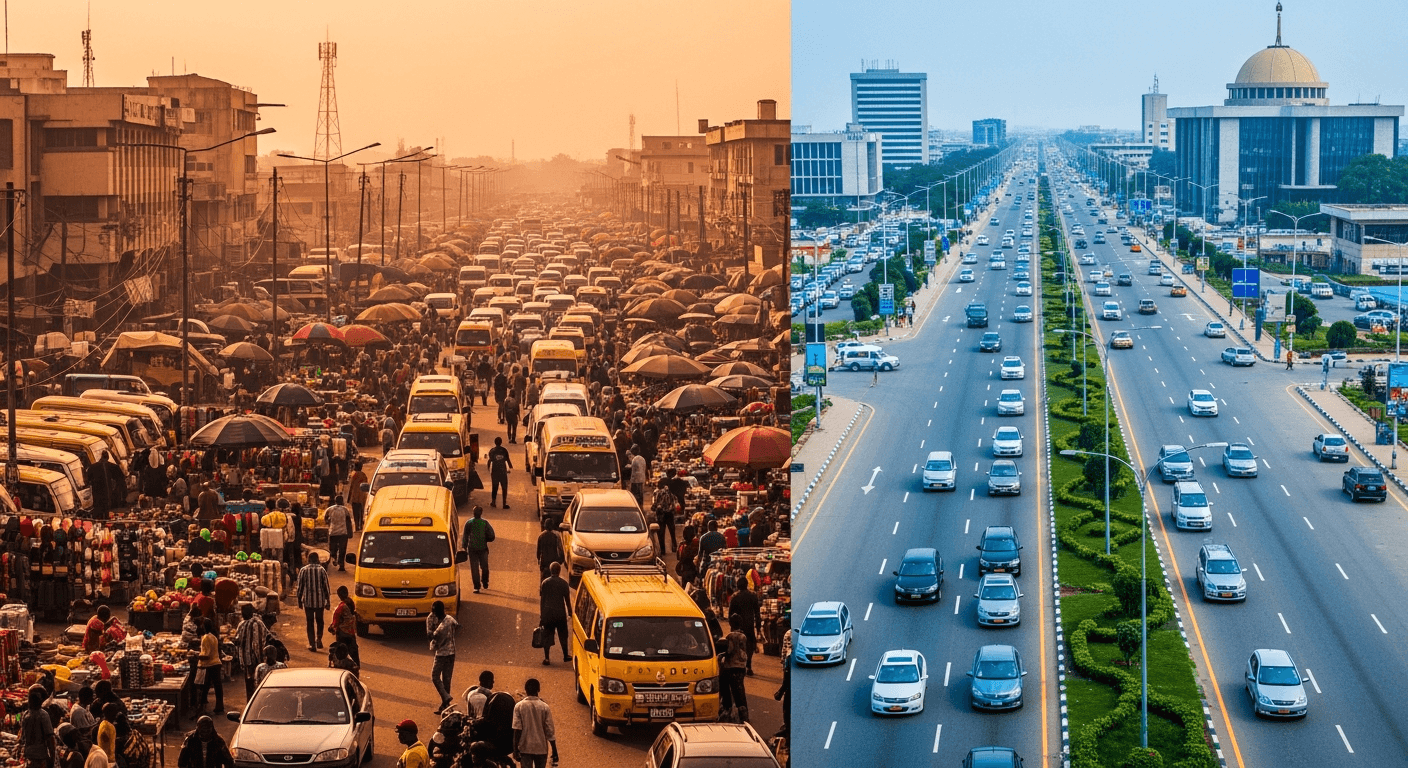
Ask any Nigerian whether Lagos or Abuja is safer, and you'll get a confident answer — but it'll depend entirely on who you ask. Lagosians will point to Abuja's kidnapping corridors. Abuja residents will cite Lagos's armed robbery rates.
With Chipon now processing data in both cities, we can finally move beyond perception and look at the numbers. The truth, as always, is more nuanced than either side admits.
Overall Safety Scores
Averaging across all monitored neighborhoods:
- Abuja: A moderately high safety profile
- Lagos: A moderate safety profile with more variance
Abuja scores higher on aggregate — but the standard deviation tells a different story. Lagos has more variance: its safest neighborhoods (Lekki Phase 1, Banana Island, parts of VI) score in the high 80s, while its riskiest areas drop below 30. Abuja is more uniform — fewer extremes in either direction.
Category Breakdown
The types of incidents differ dramatically:
Lagos: Volume and Variety
- Armed robbery: 34% of all incidents
- Traffic accidents: 22%
- Flooding: 12% (seasonal but devastating)
- Protests: 8%
- Everything else: 24%
Abuja: Lower Volume, Higher Severity
- Suspicious activity: 29% of all incidents
- Checkpoints: 19% (military presence is more visible)
- Armed robbery: 18% (lower rate but incidents tend to be more organized)
- Kidnapping reports: 11% (virtually absent in Lagos data)
- Everything else: 23%
The key insight: Lagos has more incidents but lower average severity. Abuja has fewer incidents but higher average severity. Lagos's safety challenges are street-level and opportunistic. Abuja's are more organized and targeted.
Time-of-Day Patterns
Both cities show nighttime spikes, but the curves are shaped differently:
Lagos has a broad evening risk window from 8 PM to 2 AM, reflecting its 24-hour urban rhythm. Risk tapers gradually.
Abuja has a sharp cliff after 9 PM. The city quiets dramatically — which creates opportunity for organized criminal activity with fewer witnesses. The risk window is narrower but steeper.
The Response Factor
One metric where Abuja clearly leads: official response time. Police and security services in Abuja respond to reported incidents an average of 12 minutes faster than in Lagos. This is partly infrastructure (Abuja's road network is more navigable) and partly resource allocation (the FCT receives disproportionate security funding as the federal capital).
What This Means for You
If you're moving between these cities — or choosing where to live — the data suggests different safety strategies:
- In Lagos: Focus on route planning and neighborhood selection. The difference between a safe and unsafe area can be just two streets apart. Use Chipon's heatmap religiously.
- In Abuja: Focus on timing and awareness. The city is generally safer during the day, but nighttime movement in certain corridors requires extra caution. Monitor Chipon for checkpoint and suspicious activity reports.
As Chipon expands to more Nigerian cities, we'll continue publishing these comparative analyses. Data doesn't play favorites — it just shows what's happening. What you do with it is up to you.